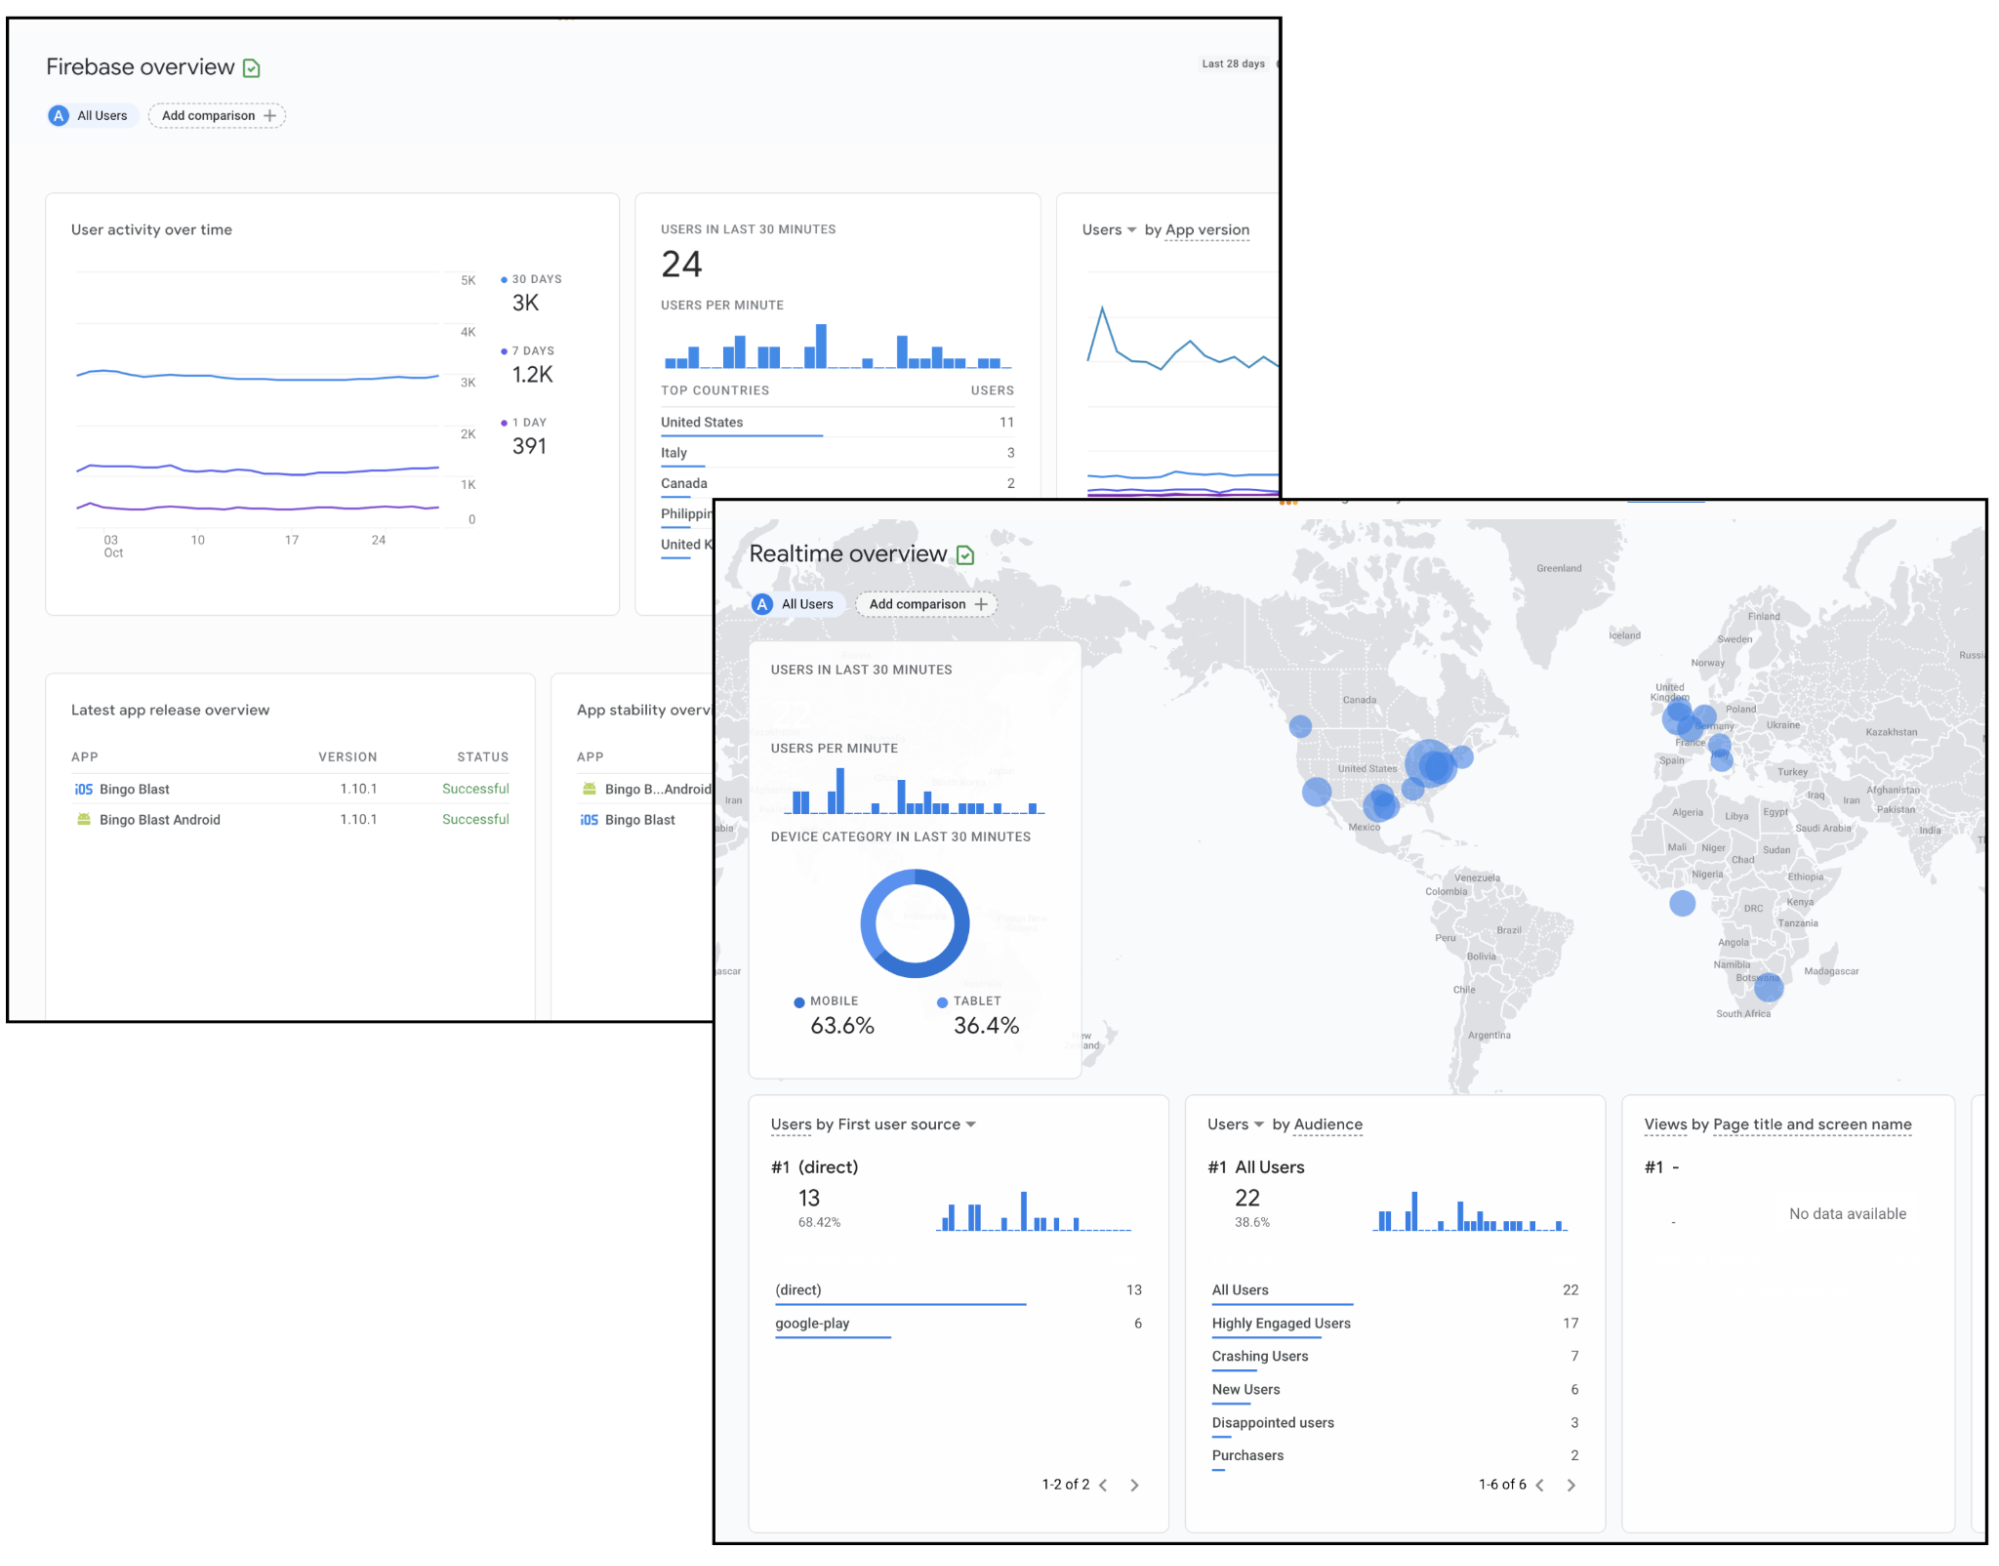
If you’ve visited the Firebase console’s Analytics section recently, you might have noticed something new… an updated Analytics dashboard, a new Realtime view and a few other UI enhancements.
These new changes are part of our effort to improve the Google Analytics experience in Firebase, by providing access to some of the newest Google Analytics 4 innovations directly in the Firebase console.
Firebase now shows a curated collection of Analytics cards that provide the same information as the previous dashboard, but presented more intuitively to get to key insights faster. This matches the ‘App Developer - Firebase’ collection in Google Analytics 4 - meaning you no longer need to switch to the Google Analytics interface to see this data. The cards are now organized by surfacing overview metrics first, followed by user engagement and retention cards, then monetization and user demographics.
The dashboard now also contains a lot of explorer cards that allow you to more easily drill-down into specifics for data represented by that card for more details - like the new App Versions card which provides a quick view into the number of users you have per app version, and a jumpoff link to see more data like engagement rates, revenue and conversions per app version as well.
The Publisher card is another example of providing a more natural flow to learn more about how different ad units are performing as well as the revenue they are generating.
Before adding this card to the dashboard, accessing this information would require digging into specific event reports, like the ad_impression event report to get out the ad unit performance or revenue data. Well, no need to go digging through various event reports anymore with this updated flow that should make accessing this information more convenient and intuitive.
Check out this Google Analytics help center article for more information about the differences between the new and older dashboard cards in the “Data cards before and after” section.
One feature that’s been around in Google Analytics 4 for a while but only just making an appearance in the Firebase console is the Comparisons tool, which replaces what was previously ‘Filters’. Similar to the Filters tool, with the Comparisons tool you can create comparison groups based on any custom or pre-defined Analytics dimensions or audiences. The advantage of the Comparisons tool is that you can create up to five comparison groups at once, and view and compare the Analytics data for each of these groups across all cards on the Analytics dashboard. For example, if you recently ran a promotional campaign offering 10% off in-app purchases to your top purchasers using Remote Config, you can check to see the impact of that at a glance on metrics like user engagement and app revenue by comparing the top purchasers audience, your most engaged users audience, and all users by applying Comparisons in the dashboard.
Note to compare events or conversions as you would have done using Filters in the past, you can navigate to the Events or Conversions card from the dashboard to reveal a detailed report that you can then apply comparisons on.
Check out this article or this video that covers how to use the Comparison tool in more detail.
The Realtime dashboard now shows the same views as in Google Analytics 4 and is great for, well, seeing events come in real-time from around the world. This can be really useful after just releasing a new feature, and seeing new events come in for the first time as it rolls out to your users. The updated dashboard contains new cards and new card capabilities, like the User Acquisition card that can be filtered by source, campaign, medium and platform, as well as the Users card that can now be filtered by audience.
One of the biggest benefits of this new change is the ability to use the Comparisons tool in the Realtime dashboard, too, so you can create and compare different groups over real-time app analytics data.
As part of this change, the Google Analytics settings page now links out to the Google Analytics console where you can modify any Analytics settings as you would previously in the Firebase > Project Settings > Integration > Google Analytics page. The Analytics Linking card however is still available and can be edited from within the Firebase console.
We invite you to take the updated Analytics dashboard in the Firebase console for a spin, and as always, let us know if you have any feedback or questions.
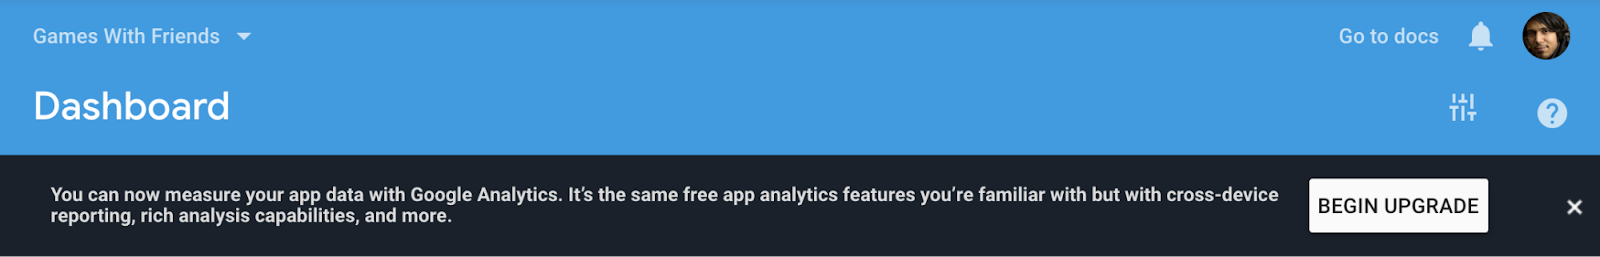
Analytics is the key to understanding your app's users: Where are they spending the most time in your app? When do they churn? What actions are they taking? To answer these questions, you need the right set of tools – and that’s why analytics has been a core part of Firebase since the beginning… and today, we’re excited to share with you that we’re adding more to our solution to help take app analytics to the next level!
Thanks to our continued partnership with Google Analytics, you can now upgrade your Firebase projects to the next generation of app analytics! This seamless upgrade requires no code changes and unlocks exciting new features while preserving data continuity. Now you can enjoy both the intuitive dashboards and free and unlimited event reporting you’re already enjoying in the Firebase console and all new capabilities to help you understand your user journeys in Google Analytics.
At a glance, here are some of the new capabilities and features you’ll be able to access in Google Analytics after making the upgrade:
The process for upgrading your existing Firebase project to the next generation Google Analytics experience is easy. Just follow the steps below to make the upgrade:
From that point, you’ll be able to access these new features in Google Analytics.
The upgrade will be available to all Firebase users over the coming weeks.
Yes! This upgrade enables a lot of new features and reports you will be able to access in Google Analytics, but will not affect your existing Firebase project analytics data in the Firebase console. You will be able to continue using the same dashboard and workflows you’re using today after the upgrade, but you’ll also have access to some advanced features in Google Analytics. Note that if you decide to enable cross-device reporting after making the upgrade, some user counts in your analytics data in the Firebase console may go down as the data will be de-duplicated with User-ID.
Cross-device reporting and unified analytics with User-ID will be available in both Google Analytics and the Analytics dashboard in the Firebase console.
To enable cross-device reporting for both, check out this article on implementing the User-ID in analytics. You can then update your Google Analytics settings in the Firebase console to view your reports using this property to enable cross-device reporting.
We are excited about the benefits this next generation app analytics experience will unlock for you, and look forward to hearing your feedback as you try out these new features!
What's the deal with audiences?
So if you've never used audiences before, they can be a really powerful way to segment your user base so that you can deliver tailored and relevant experiences to specific groups of users. Maybe that's sending them a customized notification in Firebase Cloud Messaging, maybe that's creating a unique experience for them in Remote Config, or maybe that's targeting them with a remarketing campaign in Google Ads.
Perhaps you're already familiar with Firebase Dynamic Links -- smart URLs that take the user to any location within your iOS or Android app, even if your user needs to install the app first. Over the last couple of months, the team has made some nice improvements to Dynamic Links, particularly on the iOS side of things, that will make it easier for you to use them in your apps. Let's take a look at what's new!
A while back, the Dynamic Links team added an App Preview page for situations where a user clicked on a link and didn't have the app installed on iOS. We added this because some apps -- particularly popular social ones -- tended to ignore the JavaScript redirect that took users to the App Store. So these App Preview pages provided a way to ensure that users still ended up at the App Store, like you intended. It was also a nicer experience for many users, because they were better prepared to see the App Store come up.
That said, our initial page was a little… spartan. Since introducing this page, we've made a few improvements to dress it up with graphics and assets taken either from your app store's listing in the app store, or from preview assets that you can specify directly. We've found this has lead to a significant bump in the number of users who continue to click through to the app store. And it looks better, too.
Of course, if you're still not excited about the idea of having an App Preview page, you're always welcome to remove it. You can do this by adding efr=1 to the dynamic link URL you're generating, checking the "Skip the app preview page" checkbox in the Firebase Console, or using the forcedRedirectEnabled parameter in the iOS and Android builder APIs.
efr=1
forcedRedirectEnabled
In many cases now, when you encounter error messages in your Dynamic Links implementation, we'll provide you with direct links to our documentation that describe in more detail exactly what these errors mean, and how to fix 'em. Wow! Who knew links could be used as a way to redirect users to more content that's of interest to them? Oh, wait. We did. That's our entire product.
While we're on the subject of making it easier for you to implement Dynamic Links, we've also included self-diagnostic tools with the Dynamic Links library on iOS. By calling DynamicLinks.performDiagnostics(completion: nil) anywhere within your code, the Dynamic Links library can analyze your project and let you know if it detects any common errors with your setup. It also gives you some helpful information that you should send to our troubleshooting team, if you ever need to reach out to them.
DynamicLinks.performDiagnostics(completion: nil)
In the past, when you generated a short Dynamic Link via the console, we were able to tell you how many times per day that link was clicked. While that was nice and all, we've recently boosted our analytics reports to include some more detailed information. Now we can tell you how many times per day a user re-opened your app because they clicked on a Dynamic Link, as well as how many times per day your short Dynamic Link resulted in a user opening up your app for the first time. This holds true both for the analytics you get from the Firebase Console, and also for the analytics you can retrieve using our REST API.
And, as always, if you want to add in utm parameters to your Dynamic Links, Google Analytics for Firebase can make sure it attributes any important conversion events to the Dynamic Link that brought the user to your app in the first place.
utm
All of these changes are on top of a bunch of other improvements we've made to Firebase Dynamic links over the past few months, including:
So if you haven't tried Firebase Dynamic Links lately, this would be a great time to give 'em a try! You can check out all of our documentation to get started, and you can always reach us through our support channels.
Here at Firebase, we know that the first step in making improvements in your app is knowing how your users are interacting with it: what parts they love, where they're having trouble, and what features are sadly underutilized. This is why we built Google Analytics for Firebase from the ground up to be a complete mobile analytics solution, with free and unlimited app analytics designed specifically for the way mobile apps are built.
Now, if you were paying close attention to the last paragraph, you may have noticed that the product formerly known as Firebase Analytics is now called "Google Analytics for Firebase." Don't worry; it's the same analytics product you know and love -- and we'll talk more about the name change in a bit.
Over the last year, we've made a number of improvements to Google Analytics for Firebase, including adding StreamView, which gives you an impression of how users are interacting with your app at this very moment, and DebugView, which allows you to see in precise detail what analytics events (and errors!) might be happening on a test device.
This year at Google I/O, we were thrilled to announce a number of new improvements and enhancements that make using analytics even better. In case you missed those presentations (which you can also watch on YouTube), let's give you a quick summary of what's new with Google Analytics for Firebase.
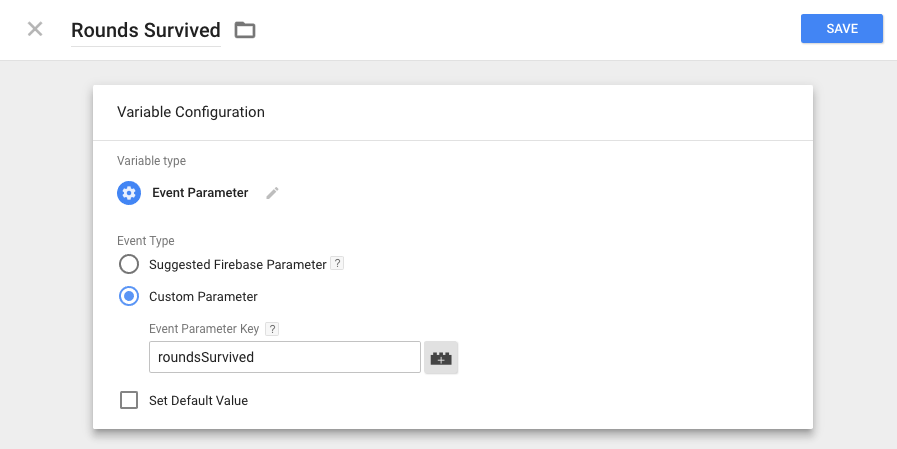
With Google Analytics for Firebase, you're allowed to submit up to 25 custom parameters alongside any events that you record in your app. For instance, if you were submitting a end_of_round event in a game, you could submit a user_score or premium_coins_earned parameter along with that event. By analyzing these different parameter values, you could then ensure that your game had the high score distribution or general payout rate that you were expecting.
end_of_round
user_score
premium_coins_earned
But up until now, it's been impossible to see the results of most of these custom event parameters without first exporting your data to BigQuery and doing the analysis there. Being able to view summaries of these event parameters directly in the Firebase console has been our most common feature request since analytics first launched last year. So we're very pleased to announce that we've taken our first big steps in making these reports available to you.
To get started with custom event parameters in Firebase, you'll need to let Google Analytics for Firebase know what parameters you're interested in. You can do this by going to the specific event in the Firebase console and clicking the "Add event parameters" button in the interface. From there, you can specify a parameter, note whether it's a number or a string, and add units of measurement, if applicable.
Once you've done that, you'll start seeing these parameter summaries directly in the console. We'll show you sums and averages for numeric values, and a list of your most popular values for strings.
Like other analytics reports available in Google Analytics for Firebase, you can filter these reports by user properties or audiences to get a better sense of how different users are interacting with your app in different ways.
Currently, you can specify up to 50 different event parameters for which you'd like to generate summary reports.
Of course, if you want to analyze a greater number of custom event parameters, or want to do more sophisticated analysis than what's available from the Firebase console, you can export your Google Analytics data directly into BigQuery, Google's data warehouse in the cloud. Analyzing your data in BigQuery is a very powerful way of running all sorts of ad hoc queries or custom analysis on your data, and we want to encourage all our developers to try it out.
To assist you on your journey, we've now added a free tier of storage in BigQuery -- 10 GB of data to be exact -- for every project using Google Analytics for Firebase. Combine this free storage tier with the 1 TB of free monthly query usage that you get from BigQuery, and you can do an awful lot of BigQuery analysis for a relatively little amount of money. And with the new analytics report templates in Data Studio, making stylish reports on custom parameters (or anything else you can measure in BigQuery) is a cinch.
We've made some major enhancements in the way Firebase and AdMob communicate with each other. Much like milk and cookies1, mixing Firebase and AdMob together results in an exciting new flavor combination that complements the strengths of both products!
By linking your AdMob account to Firebase, your app will automatically record analytics events associated with AdMob (along with mediated ad units) just like any other analytics event. This gives Google Analytics for Firebase the ability to create reports on ad impressions, clicks, and exposure time, broken down by important characteristics such as screen, ad format or ad unit. This makes it easier than ever before to see which ads are most effective in your app, where you're earning the most ad dollars, or which ads your users spend the most time viewing.
Linking your AdMob and Firebase accounts together also gives you a more complete picture of where you're making money in your app. Both the APRU reports on the dashboard and the Lifetime Value metrics in the Attribution reports will now include revenue generated from AdMob advertising, as well as in-app purchases.
This can help you gain a much more complete understanding of how your app is doing from a revenue standpoint, and help you more accurately gauge which growth campaigns are bringing you users who are earning you the most revenue.
If, like me, you enjoy spending your free time reading the latest Firebase Release Notes, you might have noticed that a few months ago, Firebase started adding screen tracking support to the events that it was recording. This month, we're taking the first steps towards adding screen tracking reports in Google Analytics for Firebase, by showing you the top three screens your users are spending time on. You can find this information in the User Engagement section of the Firebase Dashboard.
Screen tracking reporting works behind the scenes by automatically logging a screen_view event whenever a screen transition occurs. These events are then combined on the server to paint a more complete picture of the user's journey throughout your app. And just like any other event, you can view them in StreamView or DebugView, or analyze them through BigQuery. If you would like to customize these events -- for instance, you're a game developer who has multiple "screens" all within the same ViewController -- you can do so with by setting these events manually on the client.
screen_view
You can already use Google Analytics for Firebase for attribution tracking, which helps you learn not just which ad networks are sending you users, but which ones are sending you valuable users that you care about the most. And we're pleased to announce a new integration with DoubleClick Digital Marketing that will include attribution tracking for DoubleClick Campaign Manager and Bid Manager. Add this to the 50+ third-party advertising networks (and growing!) that we've integrated into our system, and Firebase can help you make better decisions around where to spend your advertising dollars with true cross-network attribution data.
If you're using the old Google Analytics Services SDK in your existing apps, don't worry; it's not going anywhere. But we encourage you to start adding the Firebase SDK in future releases. Using the Firebase SDK will give you access to the latest reports in Google Analytics for Firebase and to new functionality as it becomes available. If you're a long-time Google Analytics fan, you can use Google Tag Manager to automatically send your events data to those reports as well. If you need more help on this topic, we wrote a blog post a few months back that covers a few strategies on how to get both these analytics libraries working together in your app. Give it a read sometime!
We're thrilled to be bringing you these improvements to Google Analytics for Firebase -- they should be already available in the Give it a read sometime today (check out the demo project for an example!). If you haven't yet added analytics to your product, you can find all the documentation you need here to get started. Give it a try, and let us know what you think!
1. Or chili and mango, which Steve Ganem assures me is delicious, but sounds weird to me.↩
It's been an exciting year! Last May, we expanded Firebase into our unified app platform, building on the original backend-as-a-service and adding products to help developers grow their user base, as well as test and monetize their apps. Hearing from developers like Wattpad, who built an app using Firebase in only 3 weeks, makes all the hard work worthwhile.
first_open
in_app_purchase
"We were early testers of Cloud Functions for Firebase and were excited to see how easy it was to extend the Realtime Database to export data and integrate with other services."- Erling Mårtensson, Master Architect, Sony
"Thanks to Cloud Functions for Firebase, I built a company with no permanent employees but myself (so far), with no serious scaling concerns, and no major costs maintaining or upgrading the backend as the app grows. It's something of a miracle." - Paul Budnitz, Founder/CEO, Wuu
func recordGameOver() {
    let tracker = GAI.sharedInstance().defaultTracker
    let gameOverEvent = GAIDictionaryBuilder.createEvent(withCategory: "gameOver",
       action: "totalScore",
       label: "",
       value: myGameStats.totalScore as NSNumber)
    let enemiesBeatenEvent = GAIDictionaryBuilder.createEvent(withCategory: "gameOver",
       action: "enemiesBeaten",
       label: "",
       value: myGameStats.enemiesBeaten as NSNumber)
    let roundsSurvivedEvent = GAIDictionaryBuilder.createEvent(withCategory: "gameOver",
       action: "roundsSurvived",
       label: "",
       value: myGameStats.roundsSurvived as NSNumber)
    tracker?.send(gameOverEvent.build() as [NSObject: AnyObject])
    tracker?.send(enemiesBeatenEvent.build() as [NSObject: AnyObject])
    tracker?.send(roundsSurvivedEvent.build() as [NSObject: AnyObject])
}
  FIRAnalytics.logEvent(withName: "gameOverTotalScore",
      parameters: [kFIRParameterValue: myGameStats.totalScore as NSObject])
  FIRAnalytics.logEvent(withName: "gameOverEnemiesBeaten",
      parameters: [kFIRParameterValue: myGameStats.totalScore as NSObject])
  FIRAnalytics.logEvent(withName: "gameOverTotalScore",
      parameters: [kFIRParameterValue: myGameStats.totalScore as NSObject])
  let finalStats = ["totalScore": myGameStats.totalScore as NSObject,
                    "enemiesBeaten": myGameStats.enemiesBeaten as NSObject,
                    "roundsSurvived": myGameStats.roundsSurvived as NSObject]
  FIRAnalytics.logEvent(withName: "gameOver", parameters: finalStats)
GoogleService-info.plist
GoogleService-info
TRACKING_ID
func recordGameOver() {
    // All the old code you had previously to record Google Analytics
    // …
    // … So much code …
    // …
    // Now add the Firebase stuff
    let finalStats = ["totalScore": myGameStats.totalScore as NSObject,
                      "enemiesBeaten": myGameStats.enemiesBeaten as NSObject,
                      "roundsSurvived": myGameStats.roundsSurvived as NSObject]
    FIRAnalytics.logEvent(withName: "gameOver", parameters: finalStats)
}
func recordGameOver() {
    let finalStats = ["totalScore": myGameStats.totalScore as NSObject,
                      "enemiesBeaten": myGameStats.enemiesBeaten as NSObject,
                      "roundsSurvived": myGameStats.roundsSurvived as NSObject]
    FIRAnalytics.logEvent(withName: "gameOver", parameters: finalStats)
    // That's it!
}
SELECT
  AVG(hit.eventInfo.eventValue)
FROM
  `my_awesome_app.ga_sessions_20170123`,
  UNNEST(hits) AS hit
WHERE
  hit.eventInfo.eventCategory = "gameOver"
  AND hit.eventInfo.eventAction = "totalScore"
SELECT
  COUNT(*),
  AVG(total_score) AS average
FROM (
  SELECT
    event_param.value.int_value AS total_score
  FROM
    `firebase-project.com_example_awesome_app.app_events_20170123`,
    UNNEST(event_dim) AS event,
    UNNEST(event.params) AS event_param
  WHERE
    event.name = "gameOver"
    AND event_param.key = "totalScore"
  UNION ALL
  SELECT
    hit.eventInfo.eventValue AS total_score
  FROM
    `my_awesome_app.ga_sessions_20170123`,
    UNNEST(hits) AS hit
  WHERE
    hit.eventInfo.eventCategory = "gameOver"
    AND hit.eventInfo.eventAction = "totalScore" )